What is call center reporting?
Call center reporting involves the collection, analysis and presentation of data related to call center operations. It includes call center metrics such as call volume, call duration, call abandonment rate, first-call resolution rate and agent productivity.
What is contact center reporting?
Contact center reporting involves the collection, analysis and presentation of data related to contact center operations. Due to the fact that a contact center handles SMS, email, social media and more in addition to phone calls, contact center reporting becomes more complex than reporting for a call center.
Why is call center reporting important?
Call center reporting is essential for measuring performance, identifying areas for improvement and making informed decisions. Detailed views can highlight issues related to call center metrics like call handling times, average duration of calls, average wait time, average hold time, customer satisfaction, agent productivity and more. This information can then be used to optimize resources, improve customer service and enhance overall efficiency.
What is call center analytics?
Call center analytics is the process of gathering and interpreting data from the operations of a call center. This analysis can be used to identify potential issues, as well as where the call center is performing well. Analytics provide valuable insights into call center performance, including agent performance, hardware and software performance, customer satisfaction and more.
What are the types of call center analytics?
There are many ways to analyze the data gathered from your call center. A few of the most important call center analytics include:
- Predictive analytics — Using data from the past to predict what will happen in the future. For example, call volume from the past five holiday seasons can predict your staffing needs this December.
- Omnichannel analytics — Callers have likely already interacted with your brand on one of your other channels. Being able to see the customer’s journey across all channels allows you to better serve them.
- Speech analytics — AI can monitor calls in real time, analyzing live and providing information to call center managers on how to coach agents toward better results.
What is Genesys Cloud Analytics and Reporting?
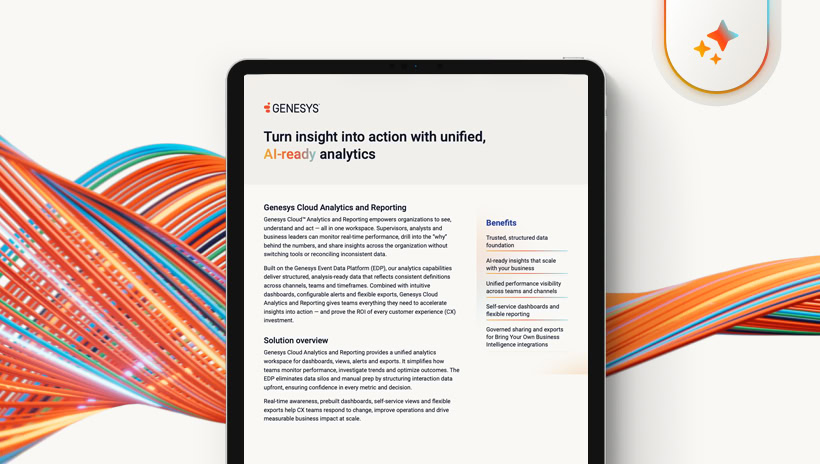
Genesys Cloud Analytics and Reporting is the built-in workspace that helps teams measure, understand and improve performance across customer interactions in one place. It brings together consistent performance metrics across channels, queues, agents and customer journeys, so leaders can move from “what happened?” to “what should we do next?” faster. It’s powered by a connected data foundation, the (Genesys Event Data Platform (EDP) which structures and unifies interaction event data so metrics are consistent and trustworthy.
What can I measure and monitor with Genesys Cloud Analytics and Reporting?
You can track performance across the moments that matter: queue health and service levels, agent activity and availability, channel/media performance, and interaction outcomes. Teams can monitor real-time conditions and analyze historical trends, then segment by time period, queue, agent/team, channel or media type to pinpoint what’s driving performance and where to take action.
How does Genesys Cloud give me real-time visibility across channels, queues and agents?
The Genesys Cloud platform surfaces real-time performance through dashboards and views designed for fast operational decisions. You can monitor key KPIs across channels and teams at a glance, then drill down by queue, agent or media type to identify what’s changing and why, so supervisors can respond quickly (adjust staffing, rebalance queues or address emerging issues before they impact service levels). Because those KPIs are calculated from the same underlying interaction data, teams get a consistent view across channels.
What’s the difference between dashboards and views, and when should I use each?
Dashboards are built for at-a-glance monitoring: a clear look at live or trending KPIs using widgets you can filter and share across teams. Views are built for deeper investigation. They help you segment performance (by time, queue, channel, agent, etc.) and drill down to uncover patterns and pinpoint root cause. In practice, use dashboards to stay on top of performance. Use views when you need to explain why a KPI moved and what to do next.
Can I build and share custom reporting dashboards and KPIs without coding?
Yes. You can start fast with prebuilt dashboards designed around common contact center goals, then tailor from there using drag-and-drop widgets, filters and custom KPIs to match how your business runs. And because sharing is built in, you can publish governed dashboards, so supervisors, analysts and leaders stay aligned on the same trusted performance view.
How do I drill down from high-level KPIs to agent activity and conversation details?
Start with dashboards to spot trends, then drill down into views to investigate what’s driving the result. When needed, go all the way to interaction detail, including conversation context and transcripts, so teams don’t just see a metric change — they can connect it to real interactions and take confident action.
How do real-time alerts work, and what can I get notified about (SLA risk, queue conditions, agent metrics)?
Real-time alerts help you stay ahead of performance shifts without constantly watching a dashboard. You can define alert conditions based on queue, user, conversation and presence-based metrics (including multi-condition rules for more complex scenarios). When thresholds are met, notifications can be delivered in-app or via email or SMS, so the right people can respond quickly to SLA risk, queue congestion or changes in agent activity and availability.
Is there a conversational interface where I can ask questions and get insights from analytics?
Genesys Cloud Copilot can help teams explore analytics using natural language so users can ask questions, get plain-language “what” and “why” answers, and quickly surface trends or drivers without building complex queries. The goal is faster insight-to-action for both leaders and frontline teams.
How can I automate reporting with scheduled exports (CSV/PDF) and share insights with stakeholders?
You can schedule recurring exports of dashboards or views in PDF or CSV so leaders, supervisors and analysts get consistent updates automatically. When you want teams working from the same view, you can share governed dashboards to ensure everyone is looking at trusted, consistent metrics across roles, regions and time zones.
How can I extend Genesys Cloud analytics to BI and data tools (Power BI/Tableau, APIs, event streaming)?
The Genesys Cloud platform is built to extend insight beyond the analytics workspace. You can connect analytics to BI tools (e.g., via exports/static links), integrate through open platform APIs and partner apps, and stream events into your broader ecosystem for downstream reporting or automation. For more advanced data needs, the event data platform and the data lakehouse provide a scalable path to structured, analytics-ready interaction data that can be used in enterprise data environments.
What is a call center dashboard?
A call center dashboard is a visual interface that displays KPIs related to call center activities. It provides real-time data on call center metrics, including:
- Call volumes
- Average handle times
- Service level
- Customer feedback, like customer satisfaction scores
- Agent utilization
- Agent performance
An intuitive, easy-to-use dashboard makes call center management much easier.
How do I get started with call center analytics?
Call center analytics is the practice of using data to understand and improve customer interactions. It involves tracking key metrics such as call volume, handling time, agent performance and customer satisfaction. By turning this information into insights, organizations can make smarter decisions that enhance both efficiency and the customer experience.
To get started, first define your goals — identify what success looks like for your team, whether that’s faster response times, higher satisfaction scores or better agent training. Next, ensure your call center platform can collect and organize the right data from all communication channels. Then, use analytics tools or dashboards to visualize trends and pinpoint issues, like long wait times or repeated customer complaints.
Finally, act on your insights. Share findings with agents and managers, adjust workflows, and continuously monitor performance. Call center analytics is most effective when it becomes part of your ongoing strategy for improvement.
What tools are commonly used for call center reporting and analytics?
Call center reporting and analytics tools help organizations track performance, understand customer behavior and make data-driven improvements. These tools gather data from calls, chats and other interactions to provide insights into metrics like call volume, average handle time, first-call resolution and customer satisfaction.
The best tool depends on your organization’s size, complexity and existing infrastructure. When selecting one, look for features such as real-time monitoring, speech and text analytics, and customizable KPIs. These capabilities empower leaders to enhance agent performance and deliver exceptional customer experiences.
What are common challenges in call center reporting and how can they be solved?
Call centers often struggle with data overload, inconsistent reporting and limited visibility across multiple channels. Too much unorganized data can make it hard to identify key performance trends or measure agent effectiveness. Inconsistent metrics between systems — such as phone, chat and email — can also lead to inaccurate conclusions and poor decision-making.
To solve these challenges, organizations should first standardize their KPIs to ensure consistency across teams and tools. Integrating data sources into a single analytics platform like Genesys Cloud helps create a unified view of performance. Automated dashboards and AI-powered analytics can reduce manual reporting and highlight actionable insights faster.
Another common issue is lack of agent engagement with analytics. This can be addressed by sharing clear, personalized performance dashboards and providing training on how to interpret results. When agents and managers understand the “why” behind the numbers, reporting becomes a powerful tool for improvement rather than just a performance check.