Your Genesys Blog Subscription has been confirmed!
Please add genesys@email.genesys.com to your safe sender list to ensure you receive the weekly blog notifications.
Subscribe to our free newsletter and get blog updates in your inbox
Don't Show This Again.

Picture this: You’re heading into a meeting with your executive team and you have two dashboards ready to present. The first one shows page views and bounce rates. The second shows real outcomes like “Plan change completed,” “Claim submitted” and “Appointment booked.” Which one do you think will get their attention?
Third-party IDs? They still matter. The shift is toward prioritizing dependable, first-party digital events tied to real outcomes, with third-party IDs adding value when anchored to that context.
Outcome-driven customer experience (CX) isn’t about getting more traffic. It’s about getting the right signal.
If page views are climbing but renewals, plan changes or claim submissions remain flat, you haven’t improved the experience. You’ve just made it louder. Traffic is just activity; outcomes are progress.
The shift sounds simple: Figure out what “done” looks like for your customer (in clear, business-relevant terms). And then make that your north star.
When teams rally around a handful of these outcome goals, prioritization gets clearer. And your measurement questions change from “How many people showed up?” to “How many customers got something done?”
Before you capture a single click, decide what “done” looks like. Use plain language everyone recognizes, your executives down to your frontline teams: For example,
Spell out the ideal path (the minimum steps that prove completion), note acceptable alternates, such as different confirmation screens, and set a few thresholds that matter like time on a step. This isn’t about collecting more data; it’s about capturing cleaner intent.
Keep it small; aim for three to five outcomes so your team stays focused. You’ll use these definitions to design signals and triggers that actually move customers forward. You’ll also use them later to tell a story that leadership cares about, such as “+1.4 points in outcome conversion” and “−17% time to done,” not just “+30% traffic.”
Once you’ve defined your outcomes, connect them to indicators you can track on your site and in your app. Think in three buckets:
1. Progress (leading) indicators suggest the customer is moving forward. Examples include: returning to the same pricing screen multiple times, running searches that show intent or reaching a specific section of a long page.
2. Friction (risk) indicators suggest a stall. Examples include: long idle time on a form, multiple returns to help articles or repeatedly abandoning a step.
3. Goal (lagging) indicators confirm completion. Examples include: the final confirmation page or a “submitted” event for a key form.
Start with the basics you already have: page and screen views, customer searches, time spent, idle time and clicks. These simple signals tell you where someone is, what they are looking for and whether they seem stuck. Refine over time with more precise signals, such as scroll depth or form submit/abandon, as your setup matures.
Don’t forget about offer interactions. When a proactive help offer pops up, how the visitor responds (accept, reject, or ignore) tells you a lot. Use those signals to be respectful of the visitor’s time and preferences for being contacted again, to control frequency and to learn where help is welcome.
Be responsible and ethical with visitor data. Keep stewardship front and center. Make sure admins can exclude sensitive parameters, filter out internal traffic and enable search tracking only where it makes sense. The goal is to capture just enough to understand progress and friction on the path to “done.”
Outcome-driven engagement isn’t about having chat windows pop up everywhere. It’s about stepping in at the right moment with the right nudge — and knowing when to step back.
For example, suppose someone scrolls through a plan comparison (clear interest) and then pauses for 45 seconds (friction). That’s your moment to offer a short side-by-side explainer or a guided walkthrough. If they accept, guide them to the right option or connect them with someone who really knows that part of the product. If they decline, don’t try again right away. Respect that signal and wait for a better moment in the journey.
Or if someone loops through the same FAQ twice in one session, that’s your cue to clarify the answer or offer a conversation that picks up right where they are.
When a conversation starts, carry the context through to the opening exchange. Put customer intent and context front and center so the first thing your team sees is why the customer is there and what they’re trying to do.
If your team can see the last few pages, the recent search and whether the customer already dismissed an offer, they can skip the “What have you tried?” routine and move right into offering help. That’s how you cut down on repeat questions and reduce handle time without adding pressure to anyone.
Treat every “help at the right moment” rule as a testable idea.
When you measure, compare the treatment group to the holdout:
Don’t forget service metrics and KPIs: time-to-completion, first-contact resolution (FCR) and average handle time (AHT). Tag outcomes as “assisted” when your timely help shortens the path, even if the final click happened later.
As results come in, tune your thresholds, expand to adjacent pages or screens, and tighten your rules to reduce false positives.
“Outcome-driven” doesn’t mean “track everything.” It means tracking what matters and being transparent about it.
Start with the minimum you need (tied directly to your top outcomes) and document what you’re collecting and why. Exclude sensitive parameters, filter internal traffic and set sensible retention windows. When stakeholders understand why you’re collecting each signal, they’re more likely to support expanding coverage and actually using the data to improve service.
Here’s how the Genesys Cloud™ platform can turns this approach into a day one reality.
Digital User Tracking is built right into Genesys Cloud; it’s not bolted on later. It lets you follow customer behavior across websites and native apps. And tracking first-party events? That’s your foundation for everything else, like proactive engagement and journey insights.
Journey signals get captured and surfaced right in the workspace where conversations happen. Agents can bring actual context into every interaction and resolve issues faster. The result is fewer questions about what you tried and more helpful answers. Organizations can also see real gains in handle time and FCR.
The events that were captured don’t just sit idle; they power more event-driven features. They trigger proactive engagement rules and generate journey insights, exactly the levers you used in Steps 2 and 3.
Most journeys don’t start and end in the same place. Genesys Cloud Customer Intents gives you a consistent view of what each person is trying to accomplish across every channel, pulling together signals from conversations, digital behavior and post-interaction analytics into one reliable data point you can use for reporting, orchestration and AI experiences.
Genesys Cloud Journey Analytics connects web and app signals to conversions that happen in other channels: chat, voice, email, etc. You get one funnel view that links digital intent to outcomes. Spot where people drop off across channels, prove attribution and prioritize fixes that actually move the needle.
Admins can selectively enable search tracking and exclude IPs, URL parameters and fragments. You can apply settings per configuration, so different sites or lines of business can tailor their tracking without creating global side effects.
Digital User Tracking comes free for AI Experience customers. There’s no need to worry about per-event pricing friction, which means teams can run broader experiments and scale confidently.
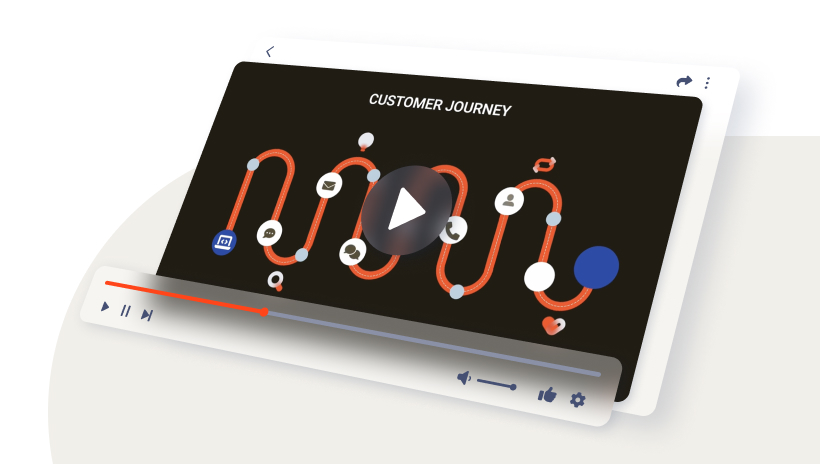
Want more information about Genesys Cloud Digital User Tracking, including how to configure and deploy Messenger-based web tracking, capture key customer behavior signals and apply privacy controls, watch this on-demand webinar and demo.
 Darius Latham
Darius Latham is a Product Marketing Manager at Genesys. With a 10+ year background in B2B product marketing and strategy consulting, he focuses on shaping and executing comprehensive go-to-market strategies...
Subscribe to our free newsletter and get blog updates in your inbox.
Related capabilities: