Your Genesys Blog Subscription has been confirmed!
Please add genesys@email.genesys.com to your safe sender list to ensure you receive the weekly blog notifications.
Subscribe to our free newsletter and get blog updates in your inbox
Don't Show This Again.

Your contact center likely offers customers several ways they can communicate with you — multichannel operations. With this diversity comes the challenge of binding communication channels together so you can deliver consistent messaging and customer treatment — all while retaining operational flexibility and a standardized view of the whole. That creates omnichannel operations.
To make multichannel operations truly omnichannel, you need to invest in technology and clearly understand the value these investments. In this blog, I’ll examine a step-by-step approach to ensure we clearly convey all the value that an omnichannel customer experience offers.
As an example, let’s compare the Battle of Thermopylae and omnichannel.
You might recall the movie “300,” where King Leonidas and his small force of Spartan warriors famously fought the Persians at Thermopylae in 480 B.C. The story has a parallel with omnichannel that lies not in the battle, but before that — when the huge Persian army had to cross the Dardanelles, one of the most treacherous waterways in the world.
To achieve the objective, ships were standardized and aligned. Then they were bound together to form two pontoons that stretched across the sea to support the vast army. The effort was centralized, and workers filled the ships with earth; engineers built a solid platform on top so that the army could then cross together as a cohesive, organized force.
King Xerxes I could have approached the problem from many fronts, given the diversity of his army. But anything other than a central bridge that could support everyone and everything would have taken more time and resources. And, with no guarantee, they ultimately would all land together at the same place on the other side — at the same time.
The industriousness of those Persians shares the same core value with today’s omnichannel customer experience platform — cohesion. Just as the Persians’ engineering capabilities provided a seamless platform to support the journey of its army – a reputed one million strong, comparable maybe to the number of customer interactions you handle annually or even weekly. Today’s engineers have created a similarly integrated and scalable platform to support customer journeys across all forms of communication channels. These journeys are consistently orchestrated to land on business outcomes that align with your strategic objectives.
Consider starting your strategy with a few words that capture the spirit of omnichannel, such as cohesion, efficiency, consistency, flexibility or rapidity.
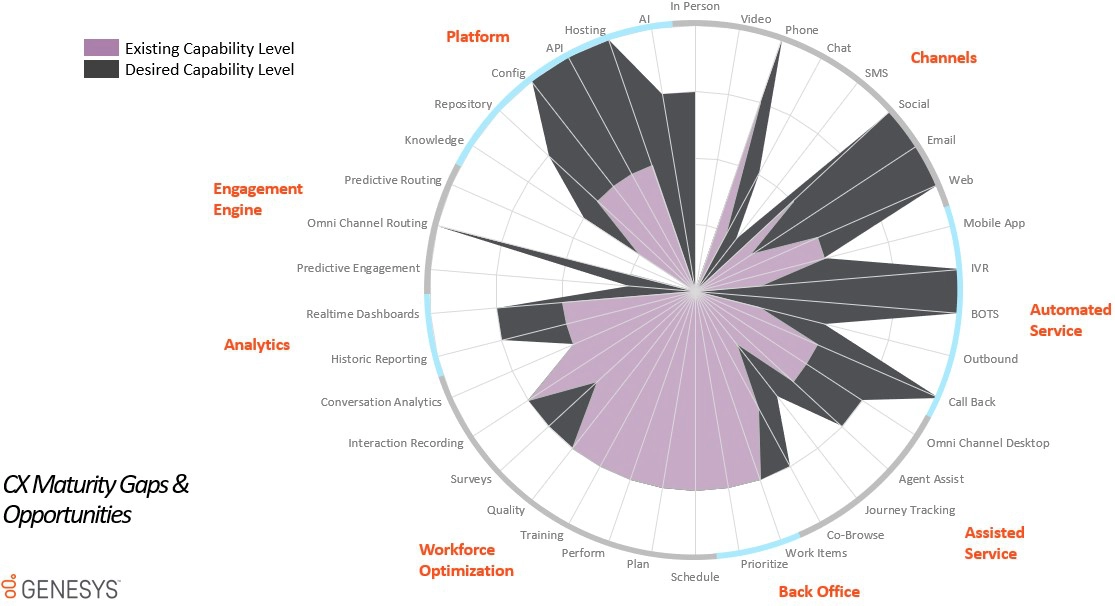
To justify an investment, you must foresee specific benefits — those that are generated by closing gaps to some desired level. Technologically, to pinpoint your critical gaps, review all of the capabilities that an integrated omnichannel platform offers. And then pinpoint your weak areas that are also most important to you.
A great way to accomplish this is through a cross-functional leadership team-working session, such as a customer experience maturity assessment that’s designed to produce the type of output shown in Figure 1. It should overlay your desired capabilities on top of your existing ones to reveal gaps.
While this serves to present technology gaps and opportunities – necessary to quantify omnichannel costs — you’ll also need to match them with the KPI opportunities those technological enhancements enable. This gives us associated omnichannel benefits.
With workflows that are integrated across channels as well as standardized cross-channel reporting that allows us to blend work, you can expand workforce groups and improve productivity. An integrated omnichannel platform reduces multi-platform complexity and cost; the integrated data it produces allows for optimal workforce management across all channels.
Cross-channel interaction history and profile data flows through a desktop to give an agent the most contextually relevant, proactive, efficient and empathetic voice or digital conversation. This should be one in which a customer doesn’t have to repeat information — the biggest detractor of customer satisfaction.
Tools like interaction analytics and surveys help you better understand what customers are telling you, where you’re failing to meet their expectations and what you can do to improve. You can gain insight into an individual agent’s development needs and then provide that development through integrated training. Blended artificial intelligence (AI) lets you discern customer needs through any channel, identify sales opportunities and route customers to the most appropriate automated or human channel.
The net result — whether enabled on-premises, in the cloud or via a hybrid model — is a more efficient interaction in the most appropriate channel to lower costs. In addition, having a more empowered and engaged employee will improve retention. And having more satisfied and loyal customers will drive revenue growth. Figure 2 captures this flow of associated KPI benefits.
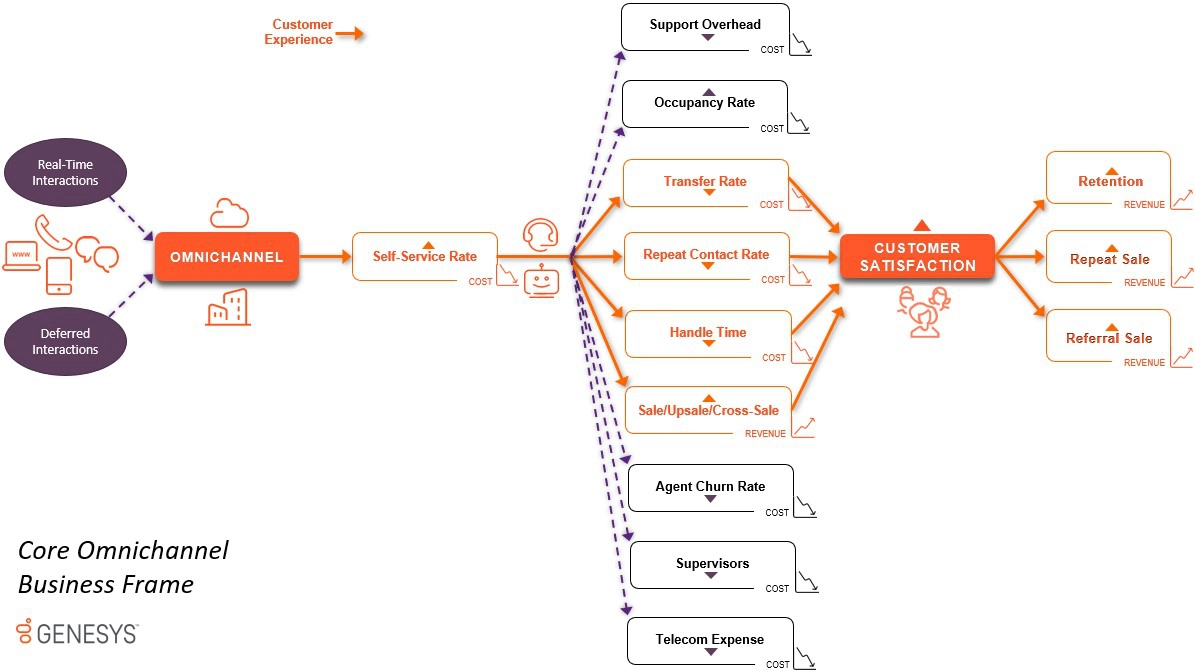
This highlights the win-win nature of omnichannel. For example, decreasing repeat contacts not only creates capacity and reduces costs, it also drives further benefits through improved customer satisfaction. This, in turn, drives revenue growth. These business frame interrelationships ensure alignment with the customer experience goals that leaders typically express (Figure 3).
To calculate specific KPI opportunities and business benefits of the enhanced capabilities prioritized within your technology frame, you need two data points for each KPI of interest:
Subtracting the results of 1 from 2 quantifies the overall uplift opportunity.
For the first point, a reporting or business analyst is a great resource to work with to establish current performance levels for a KPI based on your actual data. If plans exist elsewhere already to improve a KPI, a planning analyst can provide you with the right future target performance level, such as one that’s already in your strategic plan. This avoids double-counting benefits across projects.
The second point is trickier to calculate because the future performance level of a KPI is an estimate. To develop your forecast, use comparable internal and external benchmarks, management experience, and advisory resources such as consultants. Because uplifting a KPI can occur from more than a technology solution, it’s a good idea to record uplift at the solution level.
With mature-state KPI opportunities now known, proceed to develop a one- and two-year improvement schedule that’s staggered as appropriate for each relevant KPI within the business frame. Be sure to factor in the time to value of each. When done, the business frame output has the detail necessary to serve as input for the final step. For instance, adding interaction analytics (from the technology frame stage), the self-service rate (from the business frame stage) is projected to improve from 60% to 64% in the first year and up to 66% in the second year. This output should cover each solution and KPI that the omnichannel investment will affect.
The final step in determining and conveying the value of omnichannel is to monetize the opportunities — ROI. By modeling the KPI benefit progressions from the business frame and adding solution costs related to the technology frame and project costs, we can present economic value metrics.
In reality, it will likely take more than one attempt to optimize your investment plan and ROI, as it’s only at this point we can rank the economic value contributions of each technology solution of interest. Therefore, it’s crucial for technology and business, internal and external resources, to collaborate and iterate through processes as a team until the optimal roadmap has been developed — net of the realities of technology deployment, resource availability and, of course, budgets.
Adequately justifying a transformational investment like omnichannel means you have to cover a lot of ground. But as long as you carefully and consistently maintain the flow — from vision through technology, business and financial frames — there’s no reason why the ROI won’t occur.
To learn more about how to take your customer experience to the next level, check out our online tool and build your own omnichannel CX blueprint.
 Stuart Crutchfield
Stuart Crutchfield is a Senior Strategic Business Consultant who joined Genesys in 2012. Prior to that, he spent over 15 years building teams and processes directly supporting Fortune 100 C-suites....
Subscribe to our free newsletter and get blog updates in your inbox.