Your Genesys Blog Subscription has been confirmed!
Please add genesys@email.genesys.com to your safe sender list to ensure you receive the weekly blog notifications.
Subscribe to our free newsletter and get blog updates in your inbox
Don't Show This Again.

Customer-centric enterprises are increasing their investment in technologies that enable teams to measure and improve customer experience (CX), while achieving key business outcomes, such as maximizing customer lifetime value, reducing costs and more.
As part of a comprehensive customer journey management approach, CX leaders are adopting customer journey analytics to connect the dots between customer behavior and the KPIs by which businesses are measured. Leveraging these solutions enables you to aggregate, analyze and act on customer journey data to improve customer experiences and achieve business outcomes.

Learn how to use customer journey analytics to understand behaviors and shape experiences.
So, how are leading enterprises using customer journey analytics tools in the real world? We’ve segmented four common customer journey analytics examples that demonstrate the full potential of artificial intelligence (AI)-powered experience orchestration:
In this post, we’ll explore how businesses across industries are leveraging customer journey analytics — from reducing churn to improving customer satisfaction.
Let’s examine the first category of these customer journey examples.
Efficiently delivering services and experiences to customers is a defining challenge for enterprises. Streamlining operations and reducing the cost to serve are major priorities. But before beginning, organizations must prioritize which new initiative will most affect customer satisfaction and the bottom line.
Journey analytics enables you to effectively manage and measure customer touchpoints, revealing opportunities to optimize experiences and reduce costs.
1. Increase cost savings
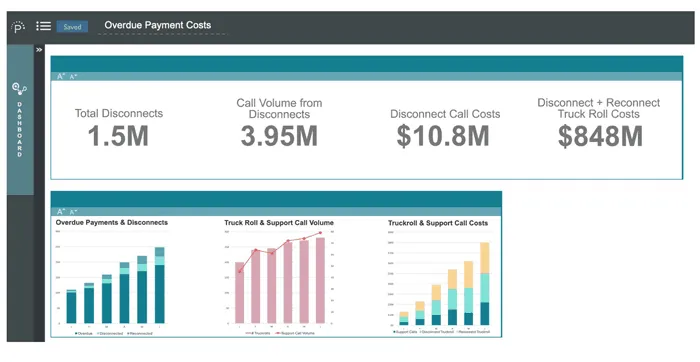
Costs associated with overdue payments are a huge problem for the utilities industry, not only because of the lost revenue due to lack of payment, but also in truck rolls — when a technician is sent to the residence to disconnect service — as well as service call costs.
The CX team at a national utility service provider notices that grossly overdue payments and service disconnects are severely affecting the bottom line — totaling almost $850 million.
To address the problem, the team analyzes the overdue payments to service disconnect journeys. It starts with customers whose payments are overdue by 33 days. Next, a truck roll occurs.
After service is disconnected, a high volume of customers reach out to the contact center about the disconnect. Once payment is received, another truck roll occurs to restore the customer’s service.
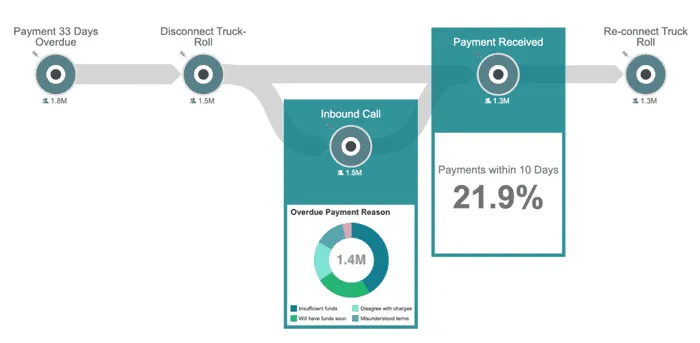
Using customer journey analytics, the team confirms that almost 22% of customers pay their bills within 10 days of the disconnect. It also discovers a significant number of customers say they’ll pay their bill when they receive their next paycheck.
By incorporating rich data from their contact center platform, the team finds that a high percentage of customers who call the service center after their service is disconnected promise to pay their bill as soon as their next paycheck is deposited. The team validates this by calculating that 22% of customers pay their bill within 10 days of the disconnect.
They see potential cost savings if the technician visit to disconnect service is scheduled to occur after the date the customer intends to pay their bill, rather than a fixed 33 days after the disconnect notice. The team implements a test to quantify the cost savings.
Within the disconnect notice, the test group is provided with a link to provide the date they intend to pay their bill. That date must fall within 14 days of the standard 33-day disconnect.
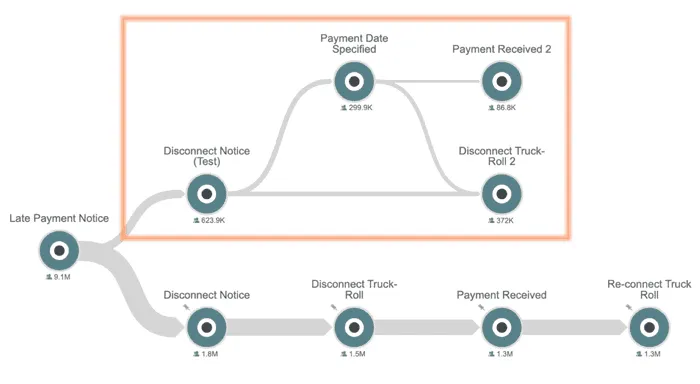
The team tests a new approach that allows customers to provide the date by which they plan to make their payment and delays disconnects until after the intended payment date.
Using advanced analytics capabilities, the team finds that, in the test group, the need to disconnect (and subsequently reconnect) service is reduced by nearly 70%. They make the case that rolling out this option to all customers in all regions could lead to nearly $1 billion in savings from unnecessary truck rolls.
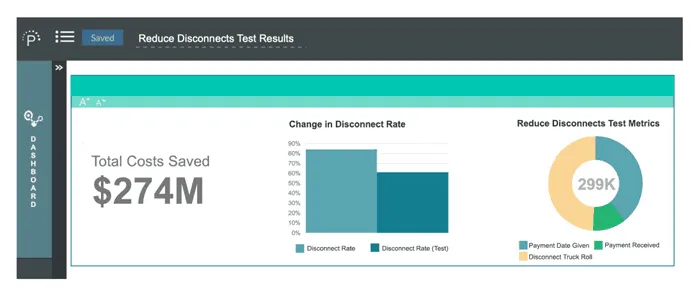
By delaying disconnects, the team finds the disconnect rate drops more than 20%, which would result in $274 million in cost savings when applied to their entire customer base.
2. Decrease support call volume and spend
A retail bank uses customer journey analytics to uncover the cause of new client service calls and increase operational efficiency.
The team wants to understand the effectiveness of their self-service channels for resolving the customer pain points of having issues when making a mortgage payment. The journey starts with the “Payment Notice Sent” event, which shows that 12.5 million customers were sent a “Payment Request” notice.
Next, they create a customer journey outline of those who went on to use each of the three self-service channels: mobile, IVR and web. And finally, they extend the journey to show customers who completed their payment after speaking with a call center agent.
Looking back from the service agent call, the team finds that the IVR is the least effective self-service channel for customers with bill payment problems. The 81% leakage from the IVR channel is nearly two times higher than mobile and web. So why is the IVR so much less effective?
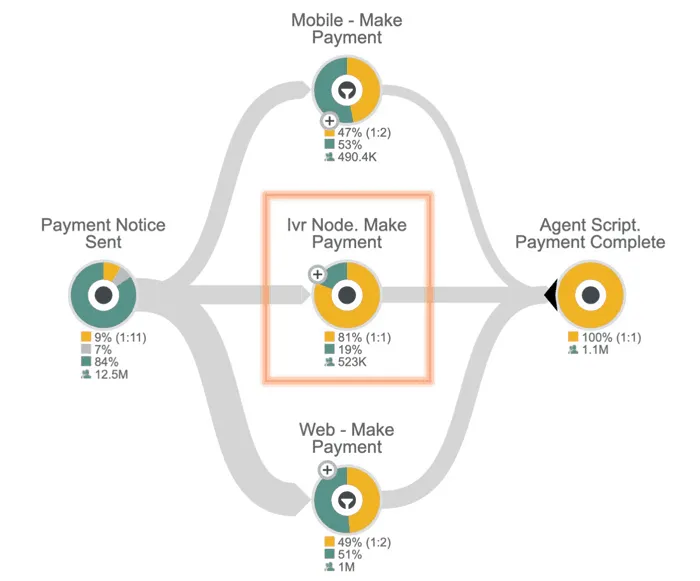
To find out, the team uses journey analytics to focus on the specific steps of the IVR micro-journey to better understand the leakage. They find that 45% of customers who attempt to make a mortgage payment through the IVR successfully complete their payment.
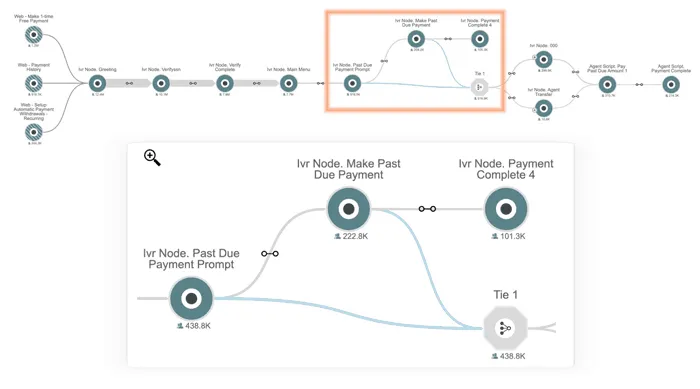
They also see that 60% of customers at the prior step abort the process and request to speak to a service agent without attempting to pay using the IVR system. The team acts on this information and analyzes the language at this specific point throughout the stages of the customer journey to better understand the issue.
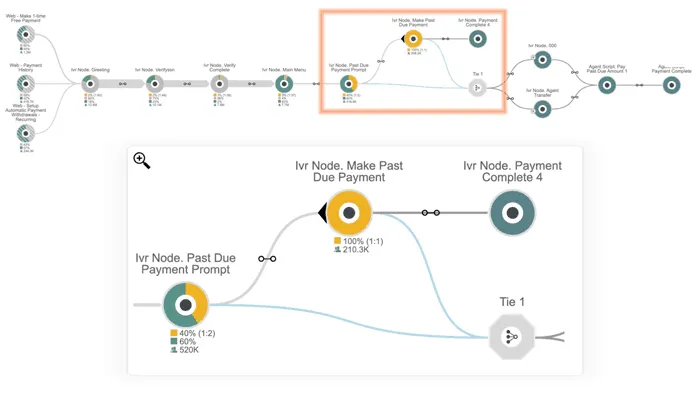
After changing the language in this specific IVR node, more customers make their payment within the IVR. This leads to a reduction in IVR leakage, call volume and call center costs.
Customer experience, analytics and marketing professionals across industries report that measuring CX in real time is one of the top five challenges encountered today.
Assessing the success of your CX initiatives and quantifying ROI starts with the ability to understand the customer behavior that positively or negatively affects metrics. By analyzing journeys, you can easily measure results, identify opportunities to improve customer experience and quantify the impact of CX initiatives.
3. Measure the impact of new CX initiatives
A leading cable, wireless and internet provider uses journey analytics to gauge the success of a new self-service appointment system intended to improve customer experience while reducing cost to serve.
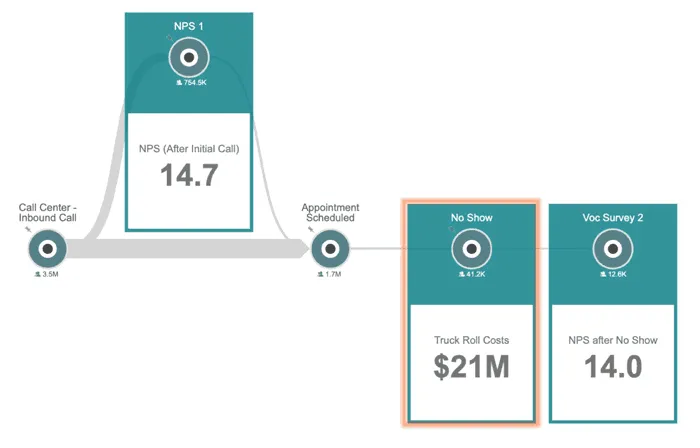
The CX team needs to understand why the current service repair micro-journey results in a decrease in Net Promoter Score (NPS). When a customer calls the care center and schedules a repair visit, their baseline NPS is 14.7. Some customers aren’t at home when the service truck arrives. For these “No Shows,” NPS drops to 14.
Based on the high “No Show” rate, the team concludes that requiring customers to call the care center to reschedule service appointments contributes to a poorer experience, as quantified by a decrease in NPS.
In addition to a poor experience, the team also calculates that service visits to customers who aren’t home cost the company $21 million.
To improve this process, the company implements a self-service appointment system that’s accessible via web, mobile and set-top box. The new system enables customers to reschedule existing appointments, add themselves on a waitlist with automated messaging when a slot opens up, and receive automated messages that narrow down the time window as the appointment time gets closer.
The team analyzes the impact of the test on customer experience so they can quantify the ROI of the investment and determine whether to roll it out to all customers.
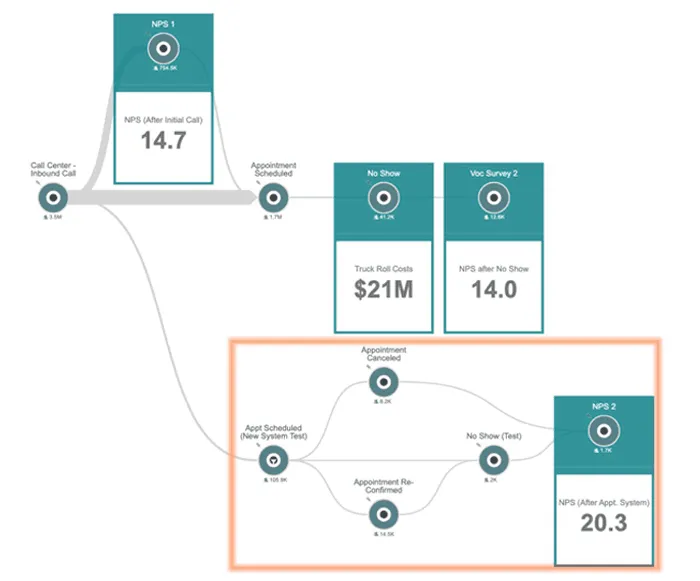
The team adds the test of the new appointment system to their journey analysis, as shown in the large orange box. They find that the experience of customers using the new self-service system is much better than the experience of those using the current approach, as quantified by a nearly 6-point increase in NPS.
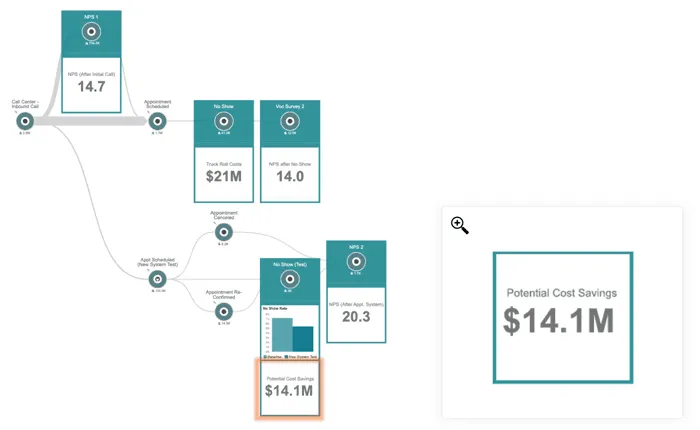
In addition to an increase in NPS, the “No Show” rate for customers using the new system drops from 7.2% to 5.4%. The team estimates that rolling out the new automated system to all customers could save $14.1 million due to the decrease in the “No Show” rate.
4. Understand what’s driving customer effort scores
A health insurance company seeks to understand why their customer effort scores (CES) are so high for newly enrolled members trying to set up automated premium payments.
To get to the root of the problem, the CX team uses customer journey analytics to examine the journeys for customers who set up automated payments via the website, mobile app and call center.
Their analysis shows that 21% of members who set up payments in the mobile app encountered an issue that leads to a service call, which results in higher CES. But members who begin payment setup over the phone or through the website are more successful and report a lower CES.
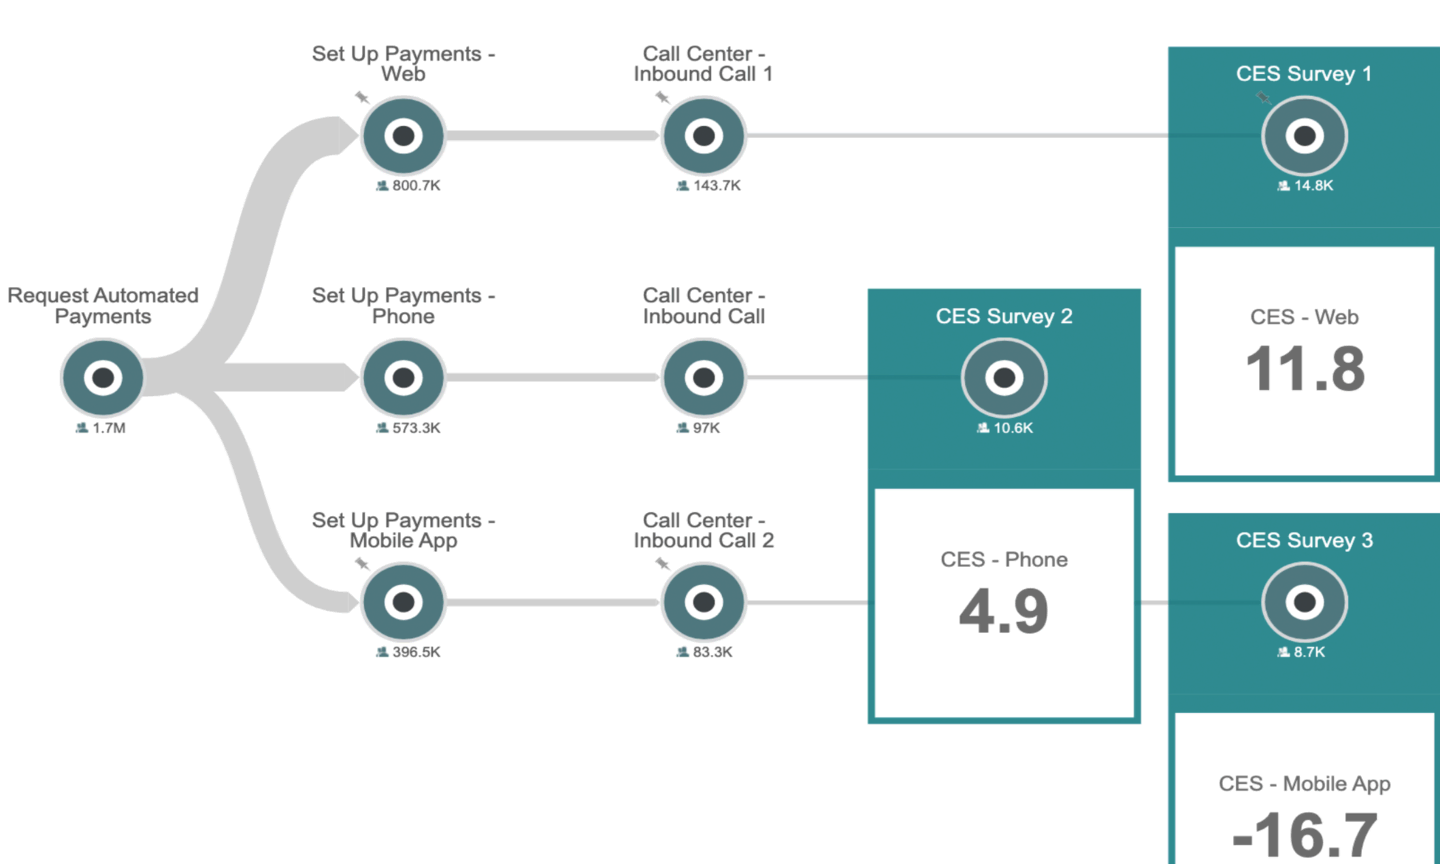
The CX team leverages this insight to prioritize a project to improve the user experience of the mobile app. In the meantime, the team can steer newly enrolled members into lower-effort journeys to improve their experiences.
Acquiring high-value customers and up-selling or cross-selling additional products and services to existing customers is an essential source of revenue growth for most enterprises. The key to success in both is to understand each customer’s unique journey context and their buyer persona.
That requires accessible, connected data. But, too often, customer data is locked in silos. One of the benefits of customer journey analytics is that it gives CX teams a visual representation into customer behavior across channels and time, defines in-journey signals that indicate the likelihood of conversion, and monitors performance toward end-of-journey success.
5. Discover up-sell opportunities
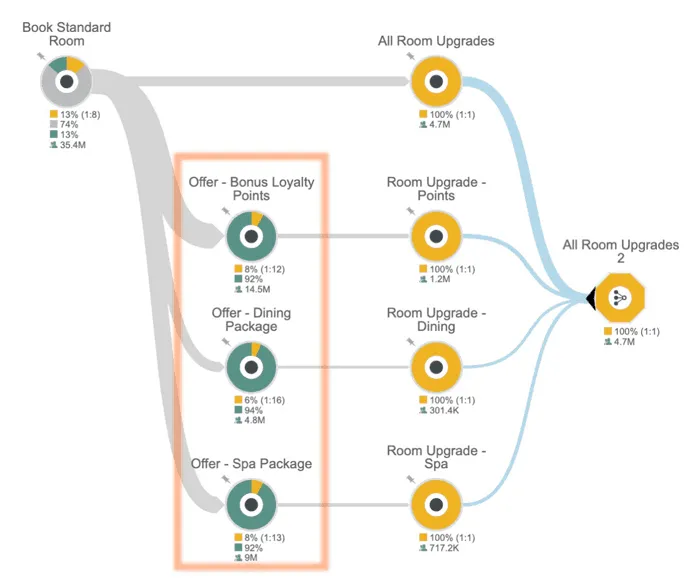
A luxury hotel and resort company uses journey analytics to identify user actions to target them with the right up-sell offers. It intends to orchestrate a personalized, omnichannel campaign to increase up-sell conversions.
First, the team wants to understand which up-sell offers are most effective for getting guests to upgrade their rooms. Starting on the top left of the journey, it looks at customers who booked a standard room, and then analyzes the effectiveness of three different up-sell offers shown in the orange box: bonus loyalty points, a dining package and a spa package.
Below each offer are the number and percentage of customers who upgraded their room by responding to each offer. Looking back at the conversion rates, the team finds that while most customers are offered extra loyalty points, the spa package converts at the same rate.
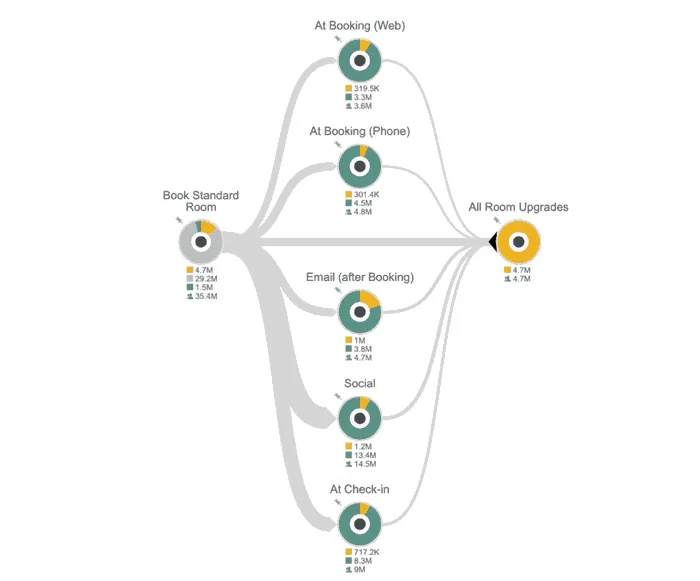
Next, the team determines the most effective channels and timing. This analysis compares the volume of up-sell conversions across five separate channels: while booking on the website, over the phone, after clicking an email or social media ad, or at the front desk at check-in.
Sending the upgrade offer via email after the initial room has been booked is converting at the highest rate, while the largest number of up-sells are generated using social ads.
Now that the team has a better understanding of which channels and offers are most effective overall, the next question to answer is “Which offers are more effective for up-selling different customers?”
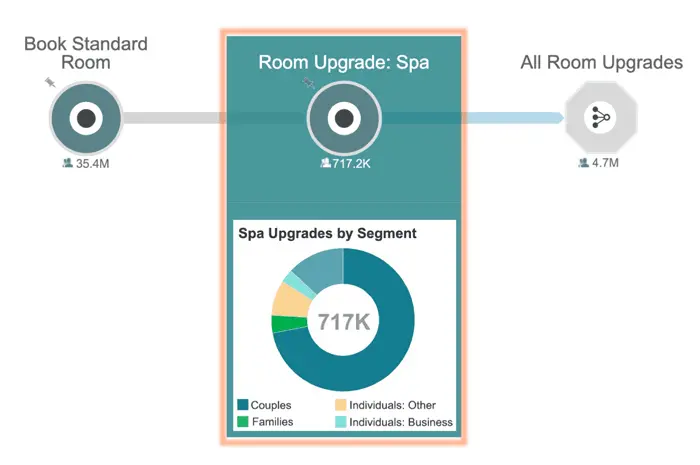
Analysis shows that over 70% of guests who upgrade through a spa package offer are couples. This offer has been far less effective for families, business travelers and other individual guests traveling alone.
In a similar analysis not shown here, they find that other offers were more effective than the spa package for some of these demographic segments. For example, business travelers and frequent guests are much more likely to convert on an offer for additional loyalty points, whereas families more commonly respond to the dining package.
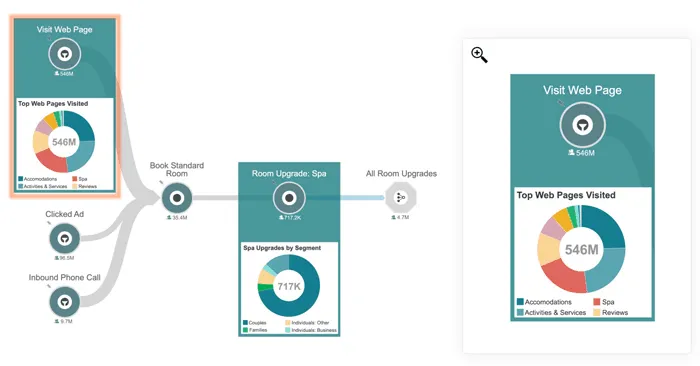
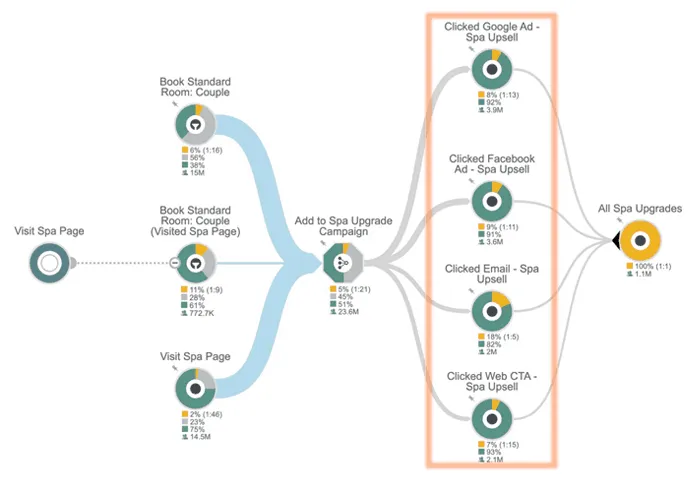
Thanks to journey analytics identity matching capabilities, the team can also look back and discover anonymous behaviors customers had across channels prior to booking a stay. They find that many of these customers who upgraded through the spa package had also visited the spa web page as an anonymous visitor before booking their standard room.
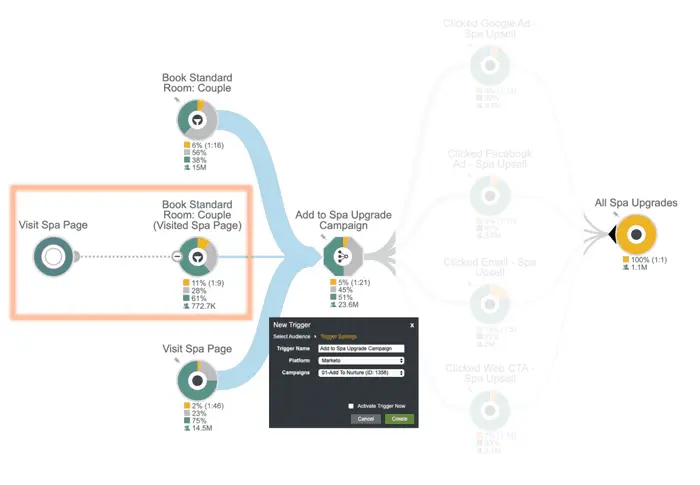
The team orchestrates a cross-channel spa up-sell campaign that targets couples and spa page visitors. The highest converting segment consists of couples who also had visited the spa page prior to booking.
In the orange box on the left, we see that this segment converted at 11% on the spa up-sell offer, while the other two segments converted at only 6% and 2%.
By focusing spa up-sell offers on this dynamic segment that combines both demographic and behavioral data from multiple sources and channels, the team can greatly increase the effectiveness and efficiency of marketing and advertising efforts to increase up-sells.
Finally, they determine which channels are most effective for each audience and up-sell offer. On the right side of the journey, we can see conversion rates for the campaign across four different channels: Google and Facebook advertising, email marketing, and personalized call to actions on the website. This analysis allows them to quantify the overall impact of their omnichannel approach. It also optimizes their campaign budget to further improve results and ROI.
Applying a similar campaign approach to their other customer segments and up-sell offers like dining and loyalty points, the team can deliver personalization at scale and improve conversion rates across the board.
6. Increase credit card conversions and improve open rates
The credit card team at a major retail bank is tasked with improving credit card opening rates among millennials. To understand the role that different channels play in credit card offers and their respective efficiencies, the bank uses customer journey analytics.
This uncovers a variety of customer journeys across online and offline channels, such as branch visits, website browsing, mobile data, email data and in-app interactions that lead customers to view a credit card offer.
Within minutes, the team discovers how many customers go on to apply for a card online versus how many rejected or ignored the offer. With one click, they can see how many customers move forward at each step, how many drop out and how many are still present at that step.
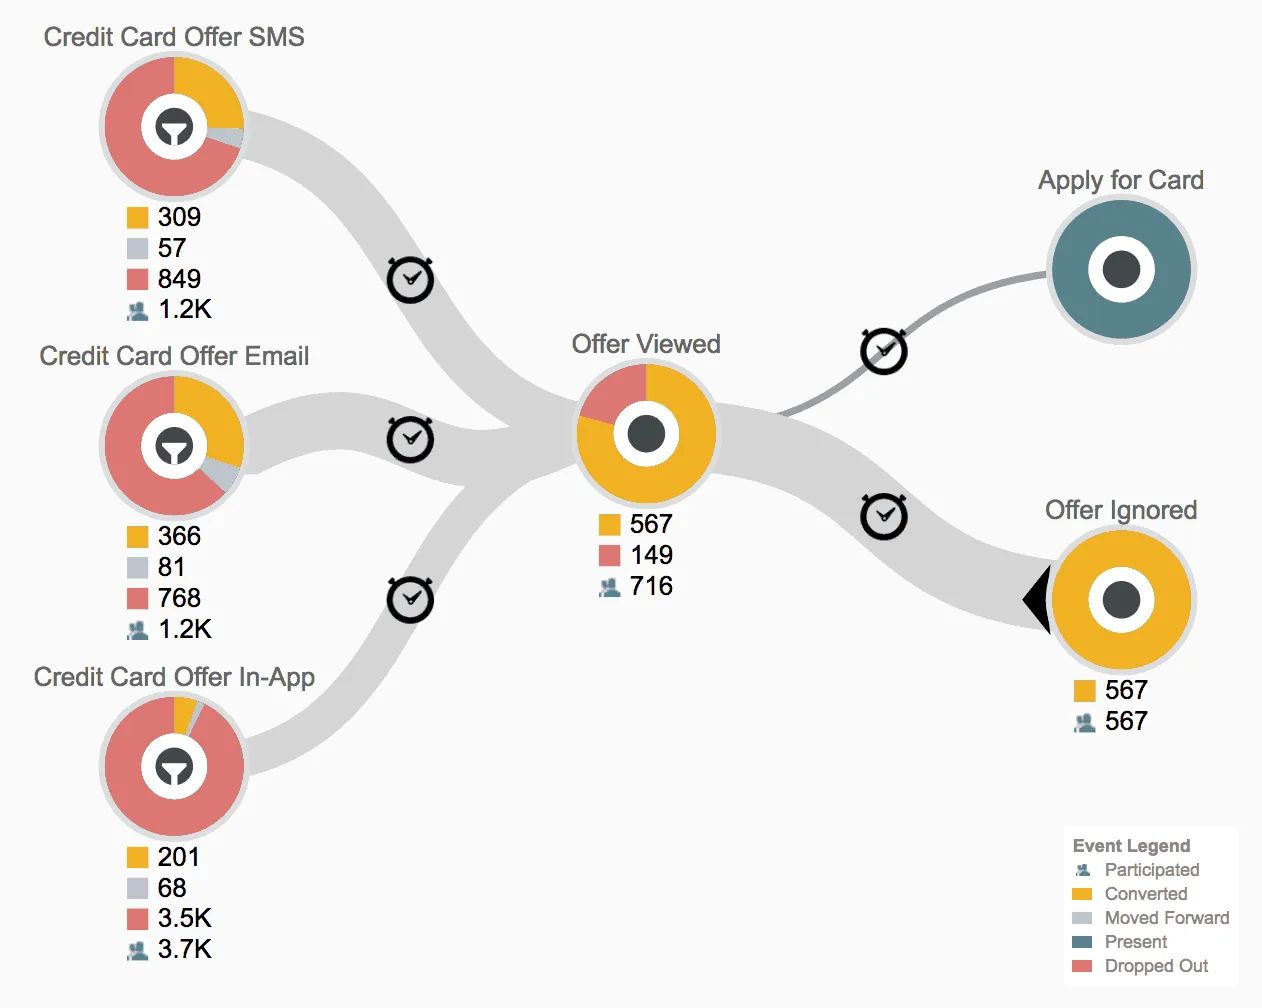
Using journey analytics, the bank determines that the offer converts better for people who see it as an email than as a text message or within the bank’s mobile app. Based on this information, they decide to send a personalized email offer to those who view the credit card offer and then abandon their journey.
Your organization’s future revenue and profitability depend heavily on retaining your customer base. For that reason, customer churn rate is a key business metric for enterprises across industries.
By understanding the drivers of customer behavior, CX leaders can reveal friction points across customer journeys, as well as identify behavioral indicators that lead to churn.
Customer-centric organizations use customer journey analytics to manage journeys and uncover actionable insights that allow them to make better decisions about how to prevent churn and maximize customer loyalty and retention.
7. Identify high-impact CX issues that lead to churn
A leading telecom provider uses customer journey analytics to understand the drivers of churn so they can identify and prioritize CX initiatives that will have the largest impact on reducing churn.
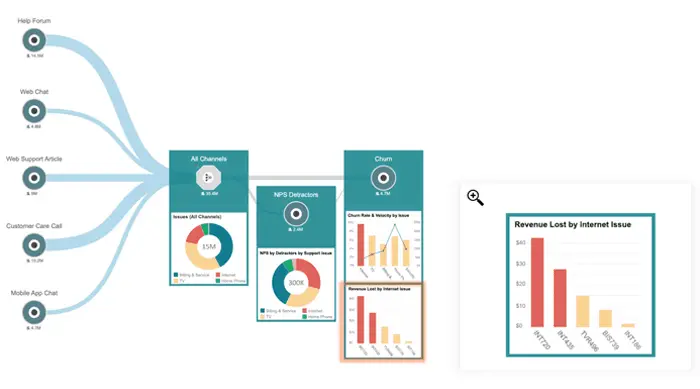
First, the team wants to discover the most common CX issues customers encounter. Customer interactions related to CX issues can occur across many different channels, which ordinarily is difficult and time-consuming to analyze. Using journey analytics, the team can easily connect all interactions to see which CX issues are most common overall.
On the left are all customer interactions across five different support channels: the help forum, web chat, web support articles, customer care calls and mobile app support. The pie chart on the right shows a breakdown by support issue category, which indicates that TV and billing related issues are by far the most prevalent issues customers experience.

The team also wants to analyze the impact these issues have on NPS and determine which problems lead to the most NPS detractors.
Below, you can see that TV and billing problems lead to a high number of detractors. And internet-related issues have an equally negative impact.
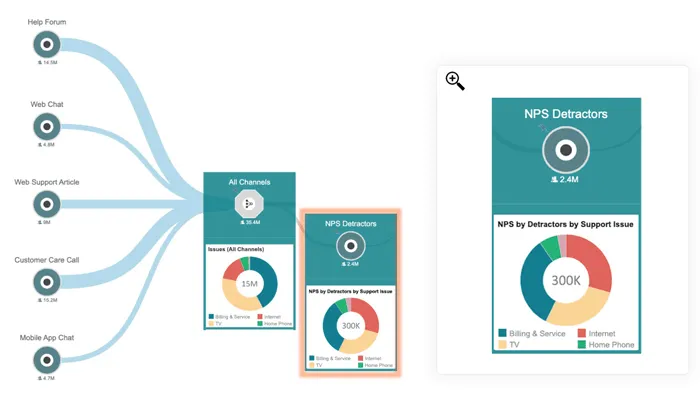
However, only a small percentage of customers actually participated in the NPS survey. So, the team decides to continue their analysis before making a conclusion.
They use customer journey analytics to analyze the effects that different CX issues have on customer churn. They find that TV and billing were the most prevalent, but internet difficulties drive the largest number of account closures and lost revenue.
Customers who experience these issues are the most likely to churn — and churn in the shortest average timeframe after having a problem.
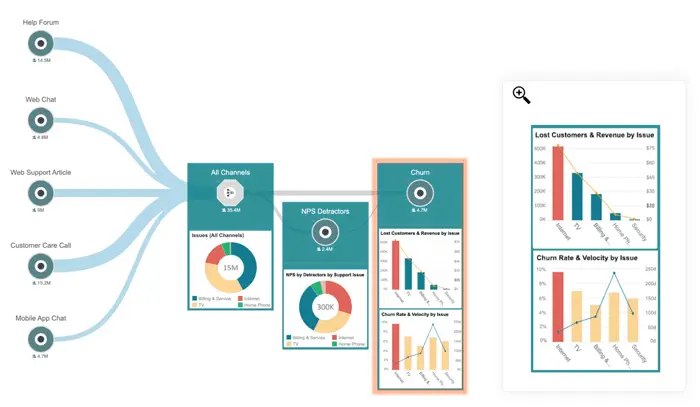
With hundreds to thousands of possible internet-related issues, knowing the category of the issue isn’t enough. So, the team uses customer journey analytics to uncover two specific internet issues that have the highest impact on churn and are responsible for the most lost revenue.
Armed with these insights, the CX team prioritizes and launches an initiative to address these issues. They anticipate this will reduce overall churn rate by 2% in the first 12 months after implementing a solution.
8. Identify customers at risk of soft churn
A retail bank uses customer journey analytics to understand customer behaviors that are predictive of soft churn and identify at-risk customers to support their customer retention efforts.
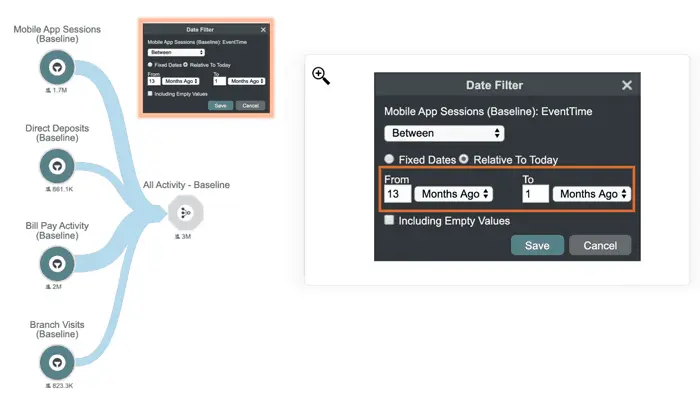
In the bank’s case, soft churn refers to customers whose activity decreases over time and suddenly, they stop adding money to their accounts. First, the team creates a rolling 12-month baseline of customer behavior that might indicate soft churn, including mobile app sessions, direct deposits, bill pay activity and branch visits.
These customer interactions across channels are included in the journey image, including a date filter applied to narrow it to a rolling 12-month window.
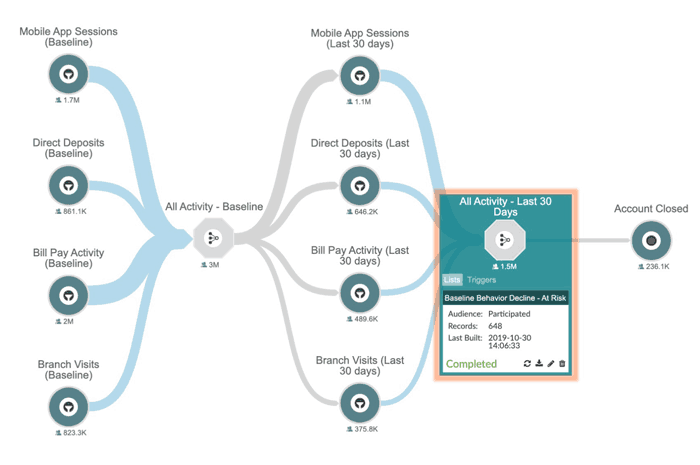
Next, they assess the same behaviors over the last 30 days to compare each customer’s most recent behavior with their behavior over the preceding 12 months.
Not surprisingly, each behavior is fairly constant at an aggregate level across the entire customer base. But what the bank really wants to find are the individual customers whose recent activity has reduced significantly when compared to their previous behavior.
The team exports a list of all individual customers with significant changes in behavior over the past 30 days, as compared with their behavior over the preceding 12 months.
Moving forward, when a customer shows signs of potential soft churn, the bank can immediately identify the customer and quickly notify the appropriate internal teams and employees.
In this way, they put these insights into the hands of employees who can act in time to prevent customers from soft churning and prevent substantial lost revenue.
Ready to wow your customers with AI-Powered Experience Orchestration? See how customer journey analytics software can enable your organization to manage, measure and improve CX.
Start by defining the goals that matter most to your customers, such as setting up an account, paying a bill or resolving a technical issue. The goal at the end of each customer journey should also map to a specific business outcome that you use to measure CX success, such as acquisition, cost savings and so on.
Customer journey analytics supports your ability to manage those crucial customer journeys, as well as measure performance and reveal opportunities for improvement. Ultimately, implementing journey analytics in your organization empowers every team across your enterprise to connect customer behavior and experiences to the KPIs you use to measure your enterprise.
 Ian Felder
Ian Felder, Product Marketing Director at Genesys, has deep knowledge and experience working in customer experience, specifically around customer journeys. In addition to leading the go-to-market efforts for the Genesys...
Subscribe to our free newsletter and get blog updates in your inbox.