Your Genesys Blog Subscription has been confirmed!
Please add genesys@email.genesys.com to your safe sender list to ensure you receive the weekly blog notifications.
Subscribe to our free newsletter and get blog updates in your inbox
Don't Show This Again.

Call centres are an operationally complex element of your business, but they play a big role in your customers’ experience with your company. Balancing the need for operational efficiency with meeting customer expectations isn’t an easy task. The right mix of call centre metrics and KPIs can help you stay the course.
Customer service leaders need to tune in to one set of KPIs, but frontline managers need a different view. As Forrester explains: “Executives need strategic KPIs to prove the business case for good customer service operations, while operational managers need to gather more comprehensive metrics in near real time to make the right decisions about the management of service requests of their workforce.”
There are many call centre metrics you can measure, but there are only a few KPIs you’ll want to monitor over a period of time. Use this definitive list to ensure you’re not missing out on any essential contact centre metrics. And refer to it when making strategic choices about which call centre KPIs to track, as well as how to use a journey-based measurement approach to optimise contact centre performance.
Customer experience (CX) leaders are well aware that a single customer service misstep can cause customers to defect. And two-thirds of companies surveyed in the “State of customer experience” report list customer satisfaction as the most important CX metric. However, CX leaders cited a lack of consistent metrics as the greatest organisational barrier to success.
Keeping watch on proven customer experience metrics can help you determine if your contact center is living up to customers’ expectations.
First-Contact Resolution
First-contact resolution (FCR) is a measure of whether customers’ problems are being resolved the first time they reach out to your organisation. Many call centre leaders view it as the most important KPI to track.
Keeping FCR low is crucial — it not only results in higher customer satisfaction and lower repeat calls but also lower cost-to-serve. Your organisation needs to decide on a standard approach for measuring this crucial KPI.
Two common approaches used are:
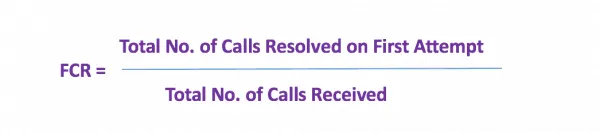
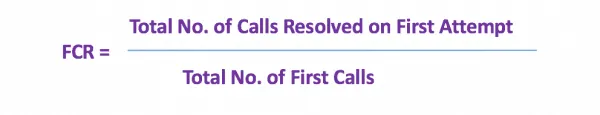
or:
The first approach includes all calls received and produces a lower FCR. However, it might give you a better picture of how well your team is doing with issue resolution on any given day or week.
The second approach produces a more accurate FCR. By excluding repeat calls, it measures the rate at which first calls are resolved on that call. Both are used in contact centres, so you must choose the right approach for your team — and be sure everyone understands your FCR parameters.
Net Promoter Score
Net Promoter Score (NPS) is a popular metric used to measure customer loyalty and satisfaction. Many companies find NPS appealing because it relies on a simple question:
“How likely is it that you would recommend [company X] to a friend or colleague?”
Customers respond using a 0-10 rating scale, with responses grouped into three categories:
NPS is calculated as the difference between the percentage of customers who are promoters and the percentage of customers who are detractors.
Customer Effort Score
Like NPS, customer effort score (CES) uses a single question to gauge customer satisfaction. CES asks customers to evaluate how much effort they had to put into reaching a resolution. Typical responses range from “Very low effort” to “Very high effort.” CES is measured on a five-point or a seven-point scale. Companies that use this scoring model can apply the following formula to calculate CES.

Customer Satisfaction
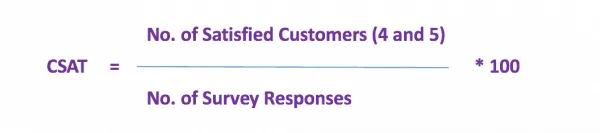
Customer satisfaction (CSAT) is a commonly used CX metric that determines how satisfied customers are with your company’s products or services. CSAT is measured at the end of a customer survey, using a five-point scale. Responses can vary from “Highly satisfied” to “Highly unsatisfied.”
CSAT scores are often expressed on a scale of 0–100%. These scores are calculated by using the following formula, with only responses of 4 (Satisfied) and 5 (Very satisfied) included in the calculation. This is because most CX practitioners believe that using the two highest values on feedback surveys is the most accurate predictor of customer retention.
Customers’ initial contact with a call centre has a strong influence on their perceptions. In your customers’ eyes, choosing to contact your business is an important investment of their time. And how you engage with them shows whether you value their business.
According to a Forrester survey, almost two-thirds of US adults online believe that valuing their time is the most important thing a brand can do to provide them with a good customer experience.
Even before customers engage with an agent, they judge your company based on how long they remain on hold — and how you communicate wait times. You can use metrics from this category to gain a view into the critical period between initiation of contact and when an agent addresses them.
First Response Time
First response time (FRT) gauges the amount of time a customer must wait before connecting with an agent. Often, contact centres look at this number daily and weekly, but also evaluate annual trends.

Percentage of Calls Blocked
With this metric, contact centres can learn how many customers receive a busy signal when they call. Ideally, this metric should be very low for most businesses.
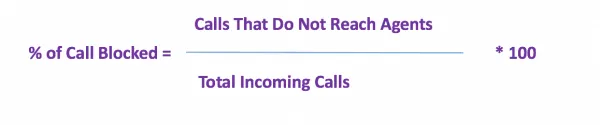
If it’s higher than expected, you might need to evaluate whether you have an adequate system for receiving incoming calls. Also, you can assess whether call lengths are excessive and causing unwanted busy tones for customers.
Average Call Abandonment Rate
If customers are waiting on hold too long, they’re likely to abandon calls. Abandoning a call can cause immense frustration for customers and make them lose faith in your company.
Customers often are more willing to wait on hold for technical support than for a sales transaction. As a general rule, an abandonment rate of less than 5% is considered acceptable, but anything above that level signals a problem.

While using this formula, most companies also exclude calls that abandon in the first five seconds, as these calls are typically made by individuals who have dialed a wrong number and realise it quickly.
Active Waiting Calls
This metric gives you quick insights into how many calls are being handled by agents and how many are on hold. Typically used in the day-to-day operations of a call centre, this KPI can help assess team performance in real time.
If too many calls are on hold, you can coach agents to work more efficiently to reduce the call backlog. This can help drive down other critical metrics, including response times and abandonment rates.
This set of call centre metrics provides a broad view into call center operational performance over time. By tracking these KPIs, CX leaders can identify peak periods, assess shifting trends and forecast staffing needs. Managers rely on them to keep tabs on day-to-day operations and achieve strategic optimisation goals.
You can also use these call centre metrics and KPIs to discern how company initiatives, such as product launches and marketing campaigns, affect call volumes and similar metrics.
Calls Handled
This KPI includes all the calls an agent touches in a specific timeframe. However, it usually doesn’t include abandoned calls. Many organisations break this metric down into two groups of calls:
Cost Per Call
The cost per call (CPC) metric provides a critical view into operational effectiveness and helps drive resource allocation. It’s the average cost for each call that a call centre handles.

Often, organisations will set a target for this KPI and track whether the call center is over or under that target.
Call Arrival Rate
With this metric, organisations assess how many incoming calls the call centre receives in a set timeframe. Operational managers might watch this KPI daily, while executives look at trends over time. Depending on the organisation’s size, they might assess the number of calls received by the day, hour or minute.

Peak Hour Traffic
Every business needs to monitor the times when the highest volume of incoming traffic occurs. With this KPI, you can forecast staffing needs and prepare your team for peak periods.
Longest Hold Time Rate
Since waiting on hold is a proven customer pain point, companies must take steps to fix this problem. Companies should know the longest time a customer had to wait for an agent — and strive to stay under this hold time.
You can express the longest hold time according to the metric that shows the duration of the longest time a single customer was on hold.
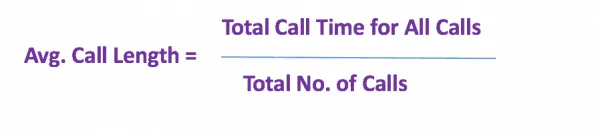
Average Call Length
This metric provides insight into the average length of calls in a given period. You can use it to set expectations with your team to help manage their workloads.
Average Age of Query
The average age of query measures the length of time unresolved queries stay open if they’re not resolved on the first attempt. Clearly, shortening the average age of the query is a good goal. A good complement to FCR, this call centre metric helps companies see how long it takes to find a solution for outstanding queries.

Callback Messaging
To avoid long wait times for reaching an agent, many companies offer customers the opportunity to receive a callback. Businesses can track the number of callback requests in a given time to understand how many customers chose this approach. Businesses can also use this KPI to assess staffing requirements to handle callbacks, improving overall efficiency.
Repeat Calls
Repeat call rate is closely related to FCR and helps companies understand the recurrence of certain issues, i.e., problems that didn’t get resolved in the first call. Tracking repeat call rate can help your company determine and resolve commonly recurring issues customers face. This can be achieved through communications, self-service options and agent training.

Channel Mix
Today’s call centres do more than answer customer calls. They also have responsibility for handling inquiries that come in through online and mobile channels. As more customers move to digital channels, voice contacts will likely fall while other self-service channels like voicebots and chatbots will grow.
Channel Containment Rate and Channel Leakage Rate
As companies add digital channels to improve customer satisfaction while decreasing contact centre costs they need to understand how well those channels are performing. The most common way to measure omnichannel behavior is by calculating the containment rate for each channel. This measures the rate at which customer contacts that initiate in any given channel are resolved without the customer needing to switch to another channel.

Conversely, channel leakage rate measures the rate at which customers who initiate on any given channel switch to another channel before their issues are resolved.

Percentage of Calls Handled by Type
Many companies find it helpful to analyse the various types of calls they receive. Customer service executives can look at this information across the entire service footprint to understand critical trends. And managers can discern whether their staff allocation aligns with contact types.
Typical types of contacts tracked include:
Call centres rely on customer-facing agents to handle inquiries efficiently and completely while keeping customers at the forefront. With this set of call centre KPIs, businesses can understand agent performance at the team level or the agent level.
Directors and managers can use this insight to motivate higher levels of performance or correct any deficiencies. In addition, they can use this data to celebrate team successes and reward top performers.
Agent Utilisation Rate
Customer service can be a labor-intensive job; businesses need to make sure team members are using their time efficiently. With the agent utilisation rate, call centers can assess the productivity of their teams.
You can get an estimate of agent utilisation rate by dividing the amount of work performed by work capacity. So if an agent works six hours of an eight-hour day, the agent utilisation rate would be 75%.
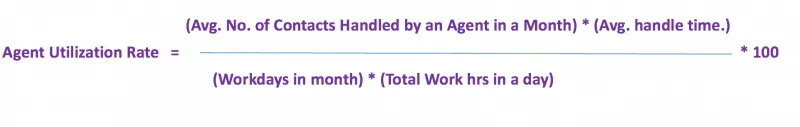
However, for a more accurate calculation, you need to factor in variables such as breaks, lunches, training, and vacation time and sick days.
Adherence to Schedule
Adherence to schedule is a productivity-related call centre metric that assesses how well agents manage their on-the-job time. High schedule adherence means agents are focusing most of their energy on addressing customer issues. Many find an adherence rate of 80% to be a good target.

Calls Answered Per Hour
Understanding how many calls your agents answer per hour is a good measure of productivity. However, you must keep in mind that this number can fluctuate due to seasonal call volumes, shift changes and other factors.

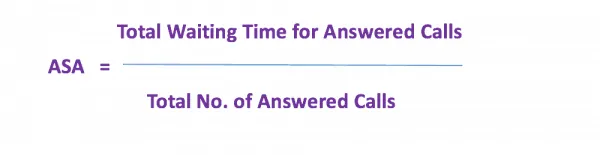
Average Speed of Answer
With this critical metric, organisations can assess average speed of answer (ASA) — how long it takes for agents to answer a waiting call. When this metric is too high, it can mean that agents are taking too long on calls or taking too much time to pick up new calls.
At times, some motivation and coaching are all agents need to improve this metric. In other instances, new processes or work tools may be valuable.
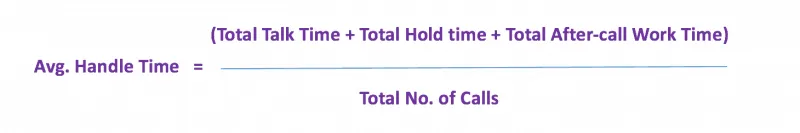
Average Handle Time
Average handle time (AHT) is the average amount of time an agent spends on a call. AHT starts as soon as the agent picks up the call and ends when they disconnect. By tracking this metric over time, you can determine average handle times for various types of calls — and set benchmarks for your agents.
When you see agents who routinely exceed this threshold, you might need to determine if they have all the skills and tools they need to properly do their jobs. However, if agents are far below this benchmark, they might be rushing through calls and not fully addressing customer issues.
Average Caller Hold Time While on the Phone with an Agent
At times, agents might need to put a caller on hold to speak with a supervisor or access information about the customer. While these hold times are necessary, call centres should always aim to keep callers on hold for the shortest times possible.

When this number is too high, system issues or agent performance can be the cause.
Transfer Rate
After connecting with an agent, customers don’t want to be transferred to someone else to handle the call. Multiple transfers cause even greater customer frustration.
While some transfers are inevitable, companies should aim to keep them to a minimum. At times, agents might need to connect customers with a supervisor to work through an issue — while other transfers direct customers to other departments.

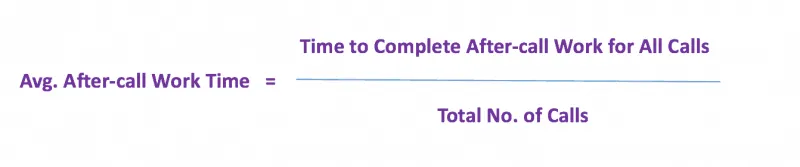
Average After-Call Work Time
Agents often need to complete some wrap-up work after a customer call. This metrics helps you assess how much time agents spend on post-call work.
When agents spend too much time closing out calls, it can signal a problem, such as an agent working too slowly. Creating templates for routine actions or eliminating unnecessary steps could help in this situation.
Monitoring these KPIs is critical for improving customer experience within the call centre and beyond. Contact centre interactions have a major impact on overall CX, so it’s crucial to monitor contact centre KPIs and connect them to end-of-journey and CX success metrics. Enterprises need to select the call centre KPIs that capture value for customers and your business.
Frontline managers need higher volumes of data that allows them to address issues and opportunities that arise in everyday operations. Executives may need to track fewer call centre KPIs but need insight into critical performance trends.
Today, leading organisations look beyond single interactions and focus on the customer journey. Contact centre leaders must embrace the truth that the customer experience extends beyond the last interaction and view it as a series of journeys that start with an individual customer’s goal and end when the company has helped them achieve that goal.
Smart companies are looking at their customers’ experiences through a journey lens to optimise contact centre experiences and performance. They are using customer journey management to better understand customer behavior, increase customer satisfaction and improve business outcomes.
In the fast-paced world of call center management, keeping a close watch on core metrics is a must. There are dozens of call center KPIs you can track, but it’s important to select the right ones for your organisation.
With the right mix of call center KPIs, you can ensure that your organisation is maximising operational efficiency and never losing sight of customer expectations.
See how the Genesys Cloud™ platform enables you to harness valuable AI capabilities to help meet and exceed contact centre KPIs through the power of experience orchestration.
*This blog, which was originally published on December 6, 2022, has been updated.
 Ian Felder
Ian Felder, Product Marketing Director at Genesys, has deep knowledge and experience working in customer experience, specifically around customer journeys. In addition to leading the go-to-market efforts for the Genesys...
Subscribe to our free newsletter and get the Genesys blog updates in your inbox.